



How to View Your VPS Metrics (CPU, RAM, Disk and Traffic)
Keeping an eye on your VPS metrics helps you catch bottlenecks early and know when it’s time to upgrade. The Client Area shows both your server specs and your recent data traffic.
Checking your specs and status
The Details tab confirms your operating system, datacenter, storage, CPU cores, memory and main IP – useful for verifying exactly what your plan provides.

Reading your traffic metrics
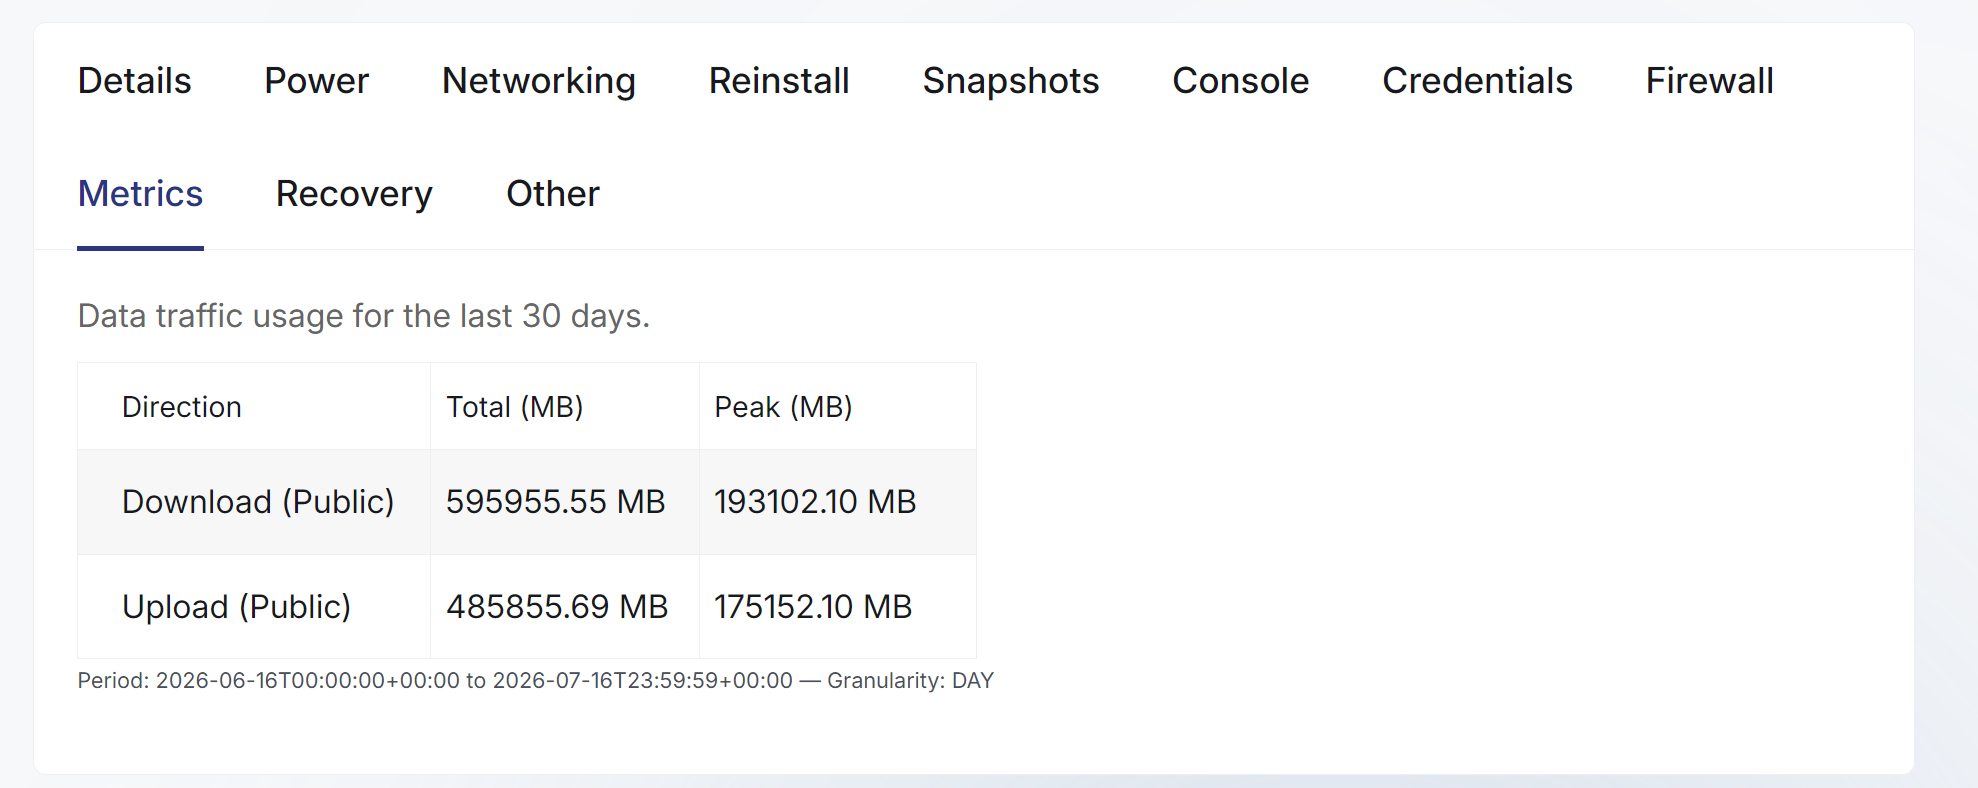
The Metrics tab shows data traffic usage for the last 30 days, split into download and upload, with totals and peaks in MB. Every JetHost VPS plan includes 30 TB of traffic per month, so this helps you see how much of that you’re using.
Watching live resource use
For real-time CPU, RAM and disk usage inside the server, connect over SSH or the console and use tools like htop, free -h and df -h. Consistently high usage is a sign it may be time to move up a plan.
JetHost Experts Tip
If your CPU or RAM regularly sits near 100%, don’t wait for things to break. Upgrading is easy and keeps your response times flat – see our guide on upgrading your VPS plan.
Need More Help?
Watching your metrics tells you when your VPS is healthy and when it’s time to scale. If you get stuck, the JetHost team is available 24/7 and usually answers in under five minutes – just contact us and we’ll help you sort it out. Explore our other VPS tutorials to get the most out of your server.